Understanding the PCE and CPI Indices: The Key Differences and Implications for Investors

Introduction

The Federal Reserve (Fed) plays a vital role in shaping the United States’ monetary policy, and one of its primary objectives is to maintain price stability. To achieve this goal, the Fed closely monitors various economic indicators, with the Personal Consumption Expenditures (PCE) and Consumer Price Index (CPI) being two of the most significant measures. In this article, we will explore the PCE and CPI indices, highlighting their differences and implications for investors.

The Personal Consumption Expenditures (PCE) Index

  1. Overview

The PCE index, published by the Bureau of Economic Analysis (BEA), measures the changes in prices of goods and services consumed by households in the United States. This index is a crucial indicator of inflation, and the Fed closely monitors it to determine its monetary policy.

  1. Calculation

The PCE index is calculated by dividing the nominal personal consumption expenditures (total spending on goods and services) by the real personal consumption expenditures (total spending adjusted for inflation). The result is then multiplied by 100 to obtain the PCE index.

  1. Components

The PCE index is divided into two main components: goods and services. Goods are further split into durable goods (items with a lifespan of more than three years) and non-durable goods (items with a lifespan of less than three years). Services include various categories, such as housing, healthcare, and transportation.

  1. Importance

The PCE index is essential because it reflects the changes in consumers’ spending habits and helps identify inflation trends. The Fed uses the PCE index to set its inflation target, which guides its monetary policy decisions, such as setting interest rates and conducting open market operations.

  1. PCE Core Index

The PCE core index is a variation of the PCE index that excludes volatile items such as food and energy prices. This measure provides a clearer picture of the underlying inflation trends, making it a valuable tool for the Fed’s policy decisions.

The Consumer Price Index (CPI)

  1. Overview

The CPI, published by the Bureau of Labor Statistics (BLS), measures the changes in the average price of a basket of goods and services consumed by urban households in the United States. The CPI is another widely used inflation indicator and serves as a benchmark for various financial instruments and contracts.

  1. Calculation

The CPI is calculated by comparing the cost of a fixed basket of goods and services at different time periods. The base year is assigned an index value of 100, and subsequent index values represent the percentage change in prices relative to the base year.

  1. Components

The CPI consists of eight major categories: food and beverages, housing, apparel, transportation, medical care, recreation, education and communication, and other goods and services. These categories are further divided into subcategories, with each item assigned a specific weight based on its importance in consumers’ spending.

  1. Importance

The CPI is critical for various reasons, such as adjusting social security benefits, determining tax brackets, and measuring the real return on investments. Many financial instruments, such as Treasury Inflation-Protected Securities (TIPS), are linked to the CPI.

  1. CPI Core Index

The CPI core index, similar to the PCE core index, excludes food and energy prices to provide a more stable measure of inflation. The CPI core index is widely used by investors and policymakers to assess underlying inflation trends.

Comparison Between PCE and CPI

Understanding the PCE and CPI Indices: The Key Differences and Implications for Investors

  1. Weighting

The primary difference between the PCE and CPI indices lies in their weighting methodology. The PCE index uses a chain-type index that allows for the substitution of goods and services, whereas the CPI uses a fixed basket of goods and services.

  1. Coverage

The PCE index covers a broader range of expenditures, including those made by nonprofit institutions and government agencies on behalf of households, while the CPI focuses solely on urban households’ spending. This difference in coverage leads to variations in the items included in each index.

  1. Data Sources

The PCE index is derived from the National Income and Product Accounts (NIPA), which uses data from various sources, including the CPI. In contrast, the CPI is based on the Consumer Expenditure Survey (CEX) and the Point-of-Purchase Survey (POPS), which collect data directly from households and retail establishments.

  1. Price Changes

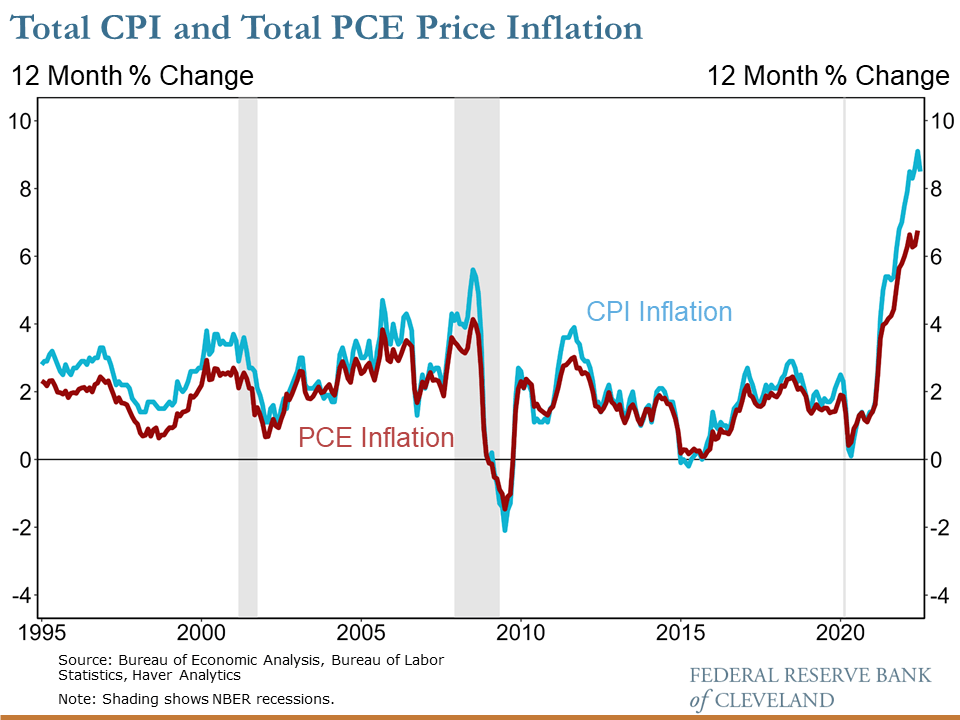
The PCE index tends to show more moderate price changes compared to the CPI due to its chain-type weighting methodology, which accounts for consumers’ substitution behavior. This difference in price sensitivity makes the PCE index a preferred measure for the Fed when assessing inflation trends.

  1. Inflation Measures

Both the PCE and CPI indices have core versions that exclude food and energy prices to provide a clearer picture of underlying inflation trends. While the Fed primarily focuses on the PCE core index, many investors and analysts also pay close attention to the CPI core index to gauge inflationary pressures.

PCE Index CPI
Item Weight % Item Weight %
Healthcare services 16.8 Shelter 32.9
Housing 15.9 New & used motor vehicles 9.2
Financial services & insurance 8.1 Food at home 8.2
Food & beverages purchased for off-premises consumption 7.6 Medical care services 7.0
Food services & accommodations 6.4 Food away from home 5.2
Pharmaceutical & other medical products 3.9 Household furnishings & operations 4.8
Motor vehicles & parts 3.7 Household fuels & utilities 4.6
Recreation services 3.6 Motor fuel 3.8
Transportation services 3.0 Communication 3.7
Furnishings & durable household equipment 2.7 Education 2.7

Conclusion

The PCE and CPI indices are both essential measures of inflation, but they differ in their weighting methodology, coverage, data sources, and price sensitivity. The Fed closely monitors the PCE index, particularly the PCE core index, to guide its monetary policy decisions. However, investors should also consider the CPI and its core version when analyzing inflation trends and making informed investment decisions. By understanding the key differences between these two indices, investors can better anticipate changes in monetary policy and make more informed decisions about their portfolios

Author:Com21.com,This article is an original creation by Com21.com. If you wish to repost or share, please include an attribution to the source and provide a link to the original article.Post Link:https://www.com21.com/pce-and-cpi.html

Like (1)
Previous April 1, 2023 4:48 pm
Next April 1, 2023 6:13 pm

Related Posts

  • A Look into the History of the US Debt-Ceiling Battles

    The United States debt ceiling is a legislative limit on the amount of national debt that the U.S. government is allowed to incur. The debt ceiling is set by Congress and any increase must also be approved by Congress. The U.S. government has reached or exceeded the debt ceiling several times in its history, leading to heated battles between the legislative and executive branches of government. One of the first major battles over the debt ceiling took place in 1917, when the U.S. entered World War I. In order to…

    January 20, 2023
    0
  • Navigating Turbulent Waters: A Comprehensive Review of US Financial Crisis and the Lessons Learned

    Introduction The United States has experienced several financial crises throughout its history, each leaving indelible marks on the nation’s economy and financial landscape. This article will review and recall some of the most significant financial crises in US history, offering unique analyses of the factors that contributed to their development, the measures taken to address them, and the lessons learned from each event. The Panic of 1907 The Panic of 1907, also known as the Knickerbocker Crisis, was triggered by a combination of factors, including a stock market crash, a…

    March 16, 2023
    0
  • Analysis of the Possibility of US Debt Default as Debt Ceiling is Hit Again and its Potential Impact

    Introduction The US government is again reaching the debt ceiling as it has been increasingly doing in recent years. As a result, an analysis of the possibility of US debt default and its potential impacts is becoming more pertinent for economists and lawmakers alike. This blog post will discuss the recent trend of US debt ceiling being reached, the likelihood of a US debt default, and its potential impacts on global financial markets. By delving into these issues, we can gain a better understanding of the fiscal situation facing the…

    February 25, 2023
    0
  • What if the U.S. Fails to Pay its Debts? The Potential Impact of the Debt Ceiling on Your Finances

    The U.S. debt ceiling has been a topic of debate for decades, and with each passing year, it becomes increasingly important to understand its impact on our finances. As the government approaches its borrowing limit once again, many Americans are wondering what would happen if the U.S. were to fail to pay its debts. In this blog post, we’ll explore the potential consequences of breaching the debt ceiling and how it could affect everything from your 401(k) to your credit cards. So grab a cup of coffee and let’s dive…

    May 24, 2023
    0
  • Has Inflation Peaked? Fed Officials Remain Uneasy Despite Easing Supply Chain Disruptions

    Inflation has been one of the most widely discussed topics among financial experts in the past few months. With supply chain disruptions easing and interest rates at 15-year highs, there is a sense that inflation may have peaked. However, Fed officials remain uneasy as labor markets remain tight and inflation could still spike. In this article, let’s take a closer look at the current state of inflation and what it could mean for our economy moving forward. Introduction to Inflation and Economic Factors Inflation has been a hot topic in…

    January 29, 2023
    0
  • U.S. yield curve reaches deepest inversion since 1981: What is it telling us?

    Hawkish comments by Federal Reserve Chairman Jerome Powell helped push a closely watched part of the U.S. Treasury yield curve to its deepest inversion since 1981 on Tuesday, once again putting a spotlight on what many investors consider a time-honored recession signal. The U.S. central bank has hiked interest rates aggressively over the last year to fight inflation that hovered around 40-year highs and bring it down to its 2% target rate. An inverted yield curve occurs when yields on shorter-dated Treasuries rise above those for longer-term ones. It suggests…

    March 9, 2023
    0
  • Surviving Economic Turmoil: Understanding Recessions, 2008 Financial Crisis and Investment Strategies in Downturns

    Recessions, also known as economic downturns, are a natural part of the business cycle. They are defined as a period of negative economic growth, typically measured by a decline in gross domestic product (GDP) for at least two consecutive quarters. Recessions can have a significant impact on individuals, businesses, and the economy as a whole. In this article, we will discuss how recessions are defined, analyze past economic downturns in the United States, and explore strategies for navigating a recession. The United States has experienced several recessions throughout its history,…

    January 27, 2023
    0
  • The Global Economic Outlook Brightens As Inflation Eases

    It’s no secret that the global economy has been struggling for years now. From high unemployment to rising prices, the economic outlook has been bleak. But, there’s good news! The economic outlook is brightening as inflation finally begins to ease. In this blog post, we’ll explore how the global economic outlook is improving and why inflation is easing. We’ll also look at what this means for businesses and consumers around the world. Get ready to dive into the data and see how it all adds up in the end! The…

    January 27, 2023
    0
  • The Debt Ceiling Battle and Its Economic Impact: Tracing the Origins of the Crisis

    Introduction With the U.S. government facing yet another debt ceiling battle, the economic impact of this recurring crisis is once again in the spotlight. But what exactly is the debt ceiling, and why does it matter? In this blog post, we’ll take a deep dive into the origins of the debt ceiling and explore important questions such as how much interest is paid on our national debt, who owns it, and what would happen if we defaulted on it. So buckle up for a fascinating exploration of one of America’s…

    April 21, 2023
    0
  • The Possible Economic Consequences Across Different Debt Limit Situations

    New analyses by both the Congressional Budget Office and the U.S. Department of the Treasury suggest the United States is rapidly approaching the date at which the government can no longer pay its bills, also known as the “X-date.” History is clear that even getting close to a breach of the U.S. debt ceiling could cause significant disruptions to financial markets that would damage the economic conditions faced by households and businesses. Real time data, shown below, indicate that markets are already pricing in political brinkmanship related to Federal government…

    May 24, 2023
    0

Leave a Reply

Your email address will not be published. Required fields are marked *