Navigating the Financial Landscape: How Commodities Lead the Way with RRG Analysis

Introduction

In the ever-evolving world of finance and investment, staying ahead of the curve is paramount. One of the tools that can assist investors in making informed decisions is the Relative Rotation Graphs (RRG). RRG is a dynamic way to visualize how various asset classes are changing relative to each other. In this blog post, we will delve into the RRG charts to identify trends, opportunities, and potential strategies for optimizing your investment portfolio.

Asset Allocation RRG

Navigating the Financial Landscape: How Commodities Lead the Way with RRG Analysis

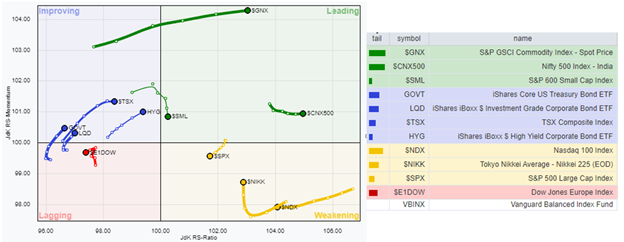
The first RRG we will explore is the Asset Allocation RRG, which evaluates multiple asset classes relative to the Vanguard Balanced Index Fund, a proxy for the traditional 60/40 portfolio. Assets on this chart rotate clockwise through four quadrants: green (leading), yellow (weakening), red (lagging), and blue (improving) concerning the Vanguard Balanced Index Fund.

The RRG reveals that the GSCI Commodity Index is currently leading the pack, followed by the India Nifty Fifty Index (NIFTY) and the S&P600 Small Cap Index (SP600). What does this mean for investors? Depending on your individual circumstances, it may be sensible to consider increasing allocations to the leading asset classes while reducing exposure to lagging and weakening assets. This strategy seeks to capitalize on the momentum and relative strength of these assets.

S&P 500 Sector RRG

Navigating the Financial Landscape: How Commodities Lead the Way with RRG Analysis

Digging deeper, we examine the S&P 500 Sector RRG. This chart dissects the sector constituents of the S&P 500 index, shedding light on sector-specific dynamics. Currently, the S&P 500 energy sector (XLE) is leading, closely followed by the financial sector (XLF). However, there’s a noteworthy development – the best-performing sectors are showing signs of weakness relative to the broader S&P 500 index.

Information technology (XLK), consumer discretionary (XLY), and communication services (XLC) are shifting into the weakening quadrant. This presents a complex scenario since these sectors collectively account for approximately 47% of the S&P 500 index. Given that energy is the primary leading sector but represents only 4.8% of the index, it could exert considerable downside pressure on the overall index.

To mitigate this imbalance, investors may consider exploring non-market cap weighted indices as an alternative. Such a move could provide a more balanced approach to sector allocation and reduce vulnerability to the underperformance of a few large sectors.

Growth vs. Value RRG

Navigating the Financial Landscape: How Commodities Lead the Way with RRG Analysis

The Growth vs. Value RRG chart adds another layer of insight to the equation. It highlights the performance of the S&P 500 growth index compared to the S&P 500 value index. Historically, growth has outperformed value, but recent developments indicate a potential shift.

As the value index begins to rotate from the improving quadrant towards the leading quadrant, the opposite is happening with the growth index. This evolving relationship has significant implications for portfolio rebalancing. Rather than sticking to rigid, date-focused rebalancing, investors may find it more effective to adopt a dynamic approach. Adjusting portfolio allocations when key indices are transitioning between leading, weakening, or lagging quadrants can lead to better outcomes.

Bond Maturities

Navigating the Financial Landscape: How Commodities Lead the Way with RRG Analysis

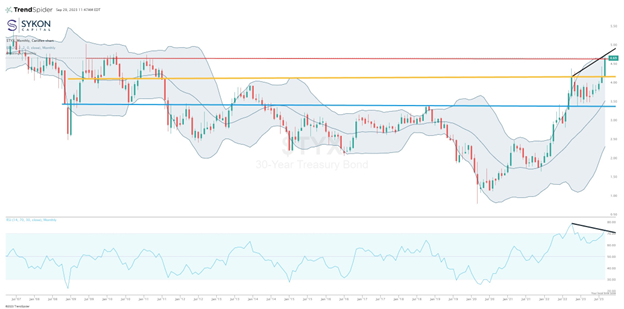
RRG charts are not limited to equities; they can also provide valuable insights into fixed income markets. The Bond Maturities RRG chart is particularly interesting, as it shows the relative movements of different maturities along the yield curve.

Currently, there’s minimal rotation among the respective maturities, with each moving towards the outer diameters of the RRG chart in their respective quadrants. This highlights the rapid deterioration of lagging positions and the potential for eventual rotation into improving or leading quadrants. Contrarian investors may identify opportunities by rotating away from leading sectors into lagging ones, anticipating a turnaround.

Conclusion

In conclusion, Relative Rotation Graphs are powerful tools that offer unique insights into the ever-changing landscape of financial markets. Whether you’re focused on asset allocation, sector analysis, or evaluating growth versus value, RRG charts can help inform your investment decisions.

Remember, investing is not one-size-fits-all, and individual circumstances, risk tolerance, and goals should guide your portfolio strategy. Consult with a qualified financial advisor to align your investment approach with your specific needs.

Please note that this information is intended for informational purposes only and should not be construed as legal, tax, or investment advice. Past performance is not indicative of future returns, and all investments carry some level of risk. Diversification does not guarantee against loss in a declining market. Always conduct thorough research and seek professional guidance when making investment decisions.

Author:Com21.com,This article is an original creation by Com21.com. If you wish to repost or share, please include an attribution to the source and provide a link to the original article.Post Link:https://www.com21.com/navigating-the-financial-landscape-how-commodities-lead-the-way-with-rrg-analysis.html

Like (1)
Previous October 2, 2023 3:08 pm
Next October 4, 2023 7:06 pm

Related Posts

  • Soybean Surge: Unpacking the Brightening Demand Picture

    Introduction The soybean market has been making headlines recently, and for good reason. With a combination of factors ranging from strong export sales to favorable domestic conditions, soybean prices are on the rise. In this blog post, we’ll delve into the key drivers behind this surge in demand for soybeans and what it means for both investors and the agricultural industry. Export Sales and Soybean Meal Prices One of the primary catalysts behind the recent soybean price surge is the strong support from export sales and soybean meal prices. Soybean…

    November 1, 2023
    0
  • Lithium and Gold Shine Bright: The Lone Stars in H1 2023 Commodities Performance

    The dawn of H2 2023 provides us with the opportune moment to reflect on the half-year performance of the commodities market. According to our regularly updated Periodic Table of Commodities Returns, just two commodities yielded positive returns during the first half of the year: lithium and gold. Riding High on Lithium In H1 2023, lithium carved out a 10.81% return, a performance that crowned it the best-performing commodity. It was also one of only two commodities to record a positive return during this period; the other was gold. Other commodities…

    July 12, 2023
    1
  • El Niño’s Embrace: Unraveling Its Impact on Global Commodities

    As weather patterns continue to astonish the world, a term frequently thrown around in the meteorological arena is “El Niño.” With the recent announcement from the World Meteorological Organization (WMO) highlighting a 90% probability of El Niño continuing through the latter half of 2023, questions arise on its implications for commodities. Let’s dive into understanding the phenomenon and its consequential ripple effect on global commodities. Understanding El Niño The El Niño Southern Oscillation (ENSO) is a pivotal oceanic-atmospheric event rooted in the irregular variations of surface water temperatures in the…

    August 18, 2023
    0
  • Outlook for Corn Prices in 2023: Key Factors to Watch

    Corn prices have been in the spotlight in recent years, with market fluctuations and demand changes affecting the global food and fuel markets. In 2023, the outlook for corn prices remains uncertain, with both positive and negative factors affecting the market. One major factor affecting corn prices in 2023 is the global demand for food and biofuels. As the world’s population continues to grow, demand for corn as a food source is expected to increase, driving up prices. Meanwhile, the increasing use of corn for biofuels is also expected to…

    February 7, 2023
    0
  • Oil’s Upward Trajectory: Navigating the Future of Energy Investments

    In the chaotic theatre of global economics, energy and its pivotal player, oil, have always been front and center. The narrative of oil in 2022 was one of ascendancy. However, this year, that storyline seems to have taken a nuanced turn. As the energy stocks slow their pace, many are left wondering about the fate of oil prices and the overall energy sector. Energy Stocks: A Pause in the Momentum Let’s dive right in: energy stocks, after their spectacular performance in 2022, are taking a pit-stop this year. While the…

    September 14, 2023
    0
  • Balancing Opportunities and Risks: A Cautiously Optimistic Outlook on the Commodities Market

    The global commodity market is an intricate, complex ecosystem that impacts every aspect of our lives – from the cars we drive to the homes we build. It is a challenging environment where a level of caution is often warranted. However, there are several reasons for an optimistic outlook, particularly within the energy sector. In June, we saw an encouraging expansion in the market breadth, with cyclical sectors adding to the rally initiated by technology shares. This was fueled by indications of tempering inflation in the face of largely resilient…

    July 21, 2023
    0
  • Weathering the Storm: The Impact of Adverse Conditions on Corn and Soybean Investments

    The agriculture markets, particularly corn and soybeans, are currently being whipped by the winds of a “weather market.” A potent combination of widespread dryness and blistering heat across major growing regions has thrown the possibility of top yields out the window. Despite hopes for improved conditions, the prospects remain slim without substantial rainfall. This persistent hot and dry weather leaves crops vulnerable, creating a volatile trading environment ripe with speculation and leading to significant rallies in corn and soybean prices. Corn and Soybeans: A Withering Tale Crop conditions across the…

    June 21, 2023
    0
  • Soybean Crop Crisis: Battling Heatwaves, Dry Spells, and Uncertain Yields

    Soybeans have long been an integral part of the global agricultural landscape, forming the foundation of countless products and a significant segment of global trade. As such, the health and yield of the soybean crop are of paramount importance to farmers, traders, and even everyday consumers. This year’s crop tour was met with heightened anticipation, especially given the early-season adversities and pronounced variability in crop growth. However, the recent findings and the unfolding climatic conditions suggest that the soybean crops might be headed for some severe challenges. Early Anticipation and…

    August 29, 2023
    0
  • Deciphering the Dynamics: The Ongoing Evolution of the U.S. Cattle Cycle

    The ebb and flow of the cattle industry is as fascinating as it is intricate. If you’ve been tracking the rise in Live Cattle and Feeder Cattle futures prices since mid-2020, you know that the industry is in a unique phase of its historical cattle cycle. Let’s delve deeper into understanding the dynamics and trends that continue to shape this crucial sector of agriculture. The Current Landscape: Prices and Droughts Recently, on August 4, 2023, front-month Feeder Cattle futures marked a record high of $249.525/cwt. This peak can be attributed…

    August 30, 2023
    0
  • Global Copper Shortage Could Last Till 2030

    According to analysts, a global copper deficit is expected to affect the markets throughout 2023 and potentially last for the rest of the decade. The current shortage is being driven by challenges in South American supply streams and rising demand.Copper plays a crucial role in measuring the economic health as it is widely used in various applications, including electrical equipment and industrial machinery. A shortage of copper may signal a worsening of global inflationary pressures, leading to a prolonged hawkish stance by central banks.Robin Griffin, Vice President of Metals and…

    February 7, 2023
    0

Leave a Reply

Your email address will not be published. Required fields are marked *