U.S. yield curve reaches deepest inversion since 1981: What is it telling us?

Hawkish comments by Federal Reserve Chairman Jerome Powell helped push a closely watched part of the U.S. Treasury yield curve to its deepest inversion since 1981 on Tuesday, once again putting a spotlight on what many investors consider a time-honored recession signal.

U.S. yield curve reaches deepest inversion since 1981: What is it telling us?

The U.S. central bank has hiked interest rates aggressively over the last year to fight inflation that hovered around 40-year highs and bring it down to its 2% target rate.

An inverted yield curve occurs when yields on shorter-dated Treasuries rise above those for longer-term ones. It suggests that while investors expect interest rates to rise in the near term, they believe that higher borrowing costs will eventually hurt the economy, forcing the Fed to later ease monetary policy.

The phenomenon is closely watched by investors as it has preceded past recessions.

The yield curve inverted further on Tuesday after Powell told Congress the Fed would need to raise rates higher than previously anticipated in response to recent data showing that growth and inflation remain strong despite a barrage of rate increases over the past year.

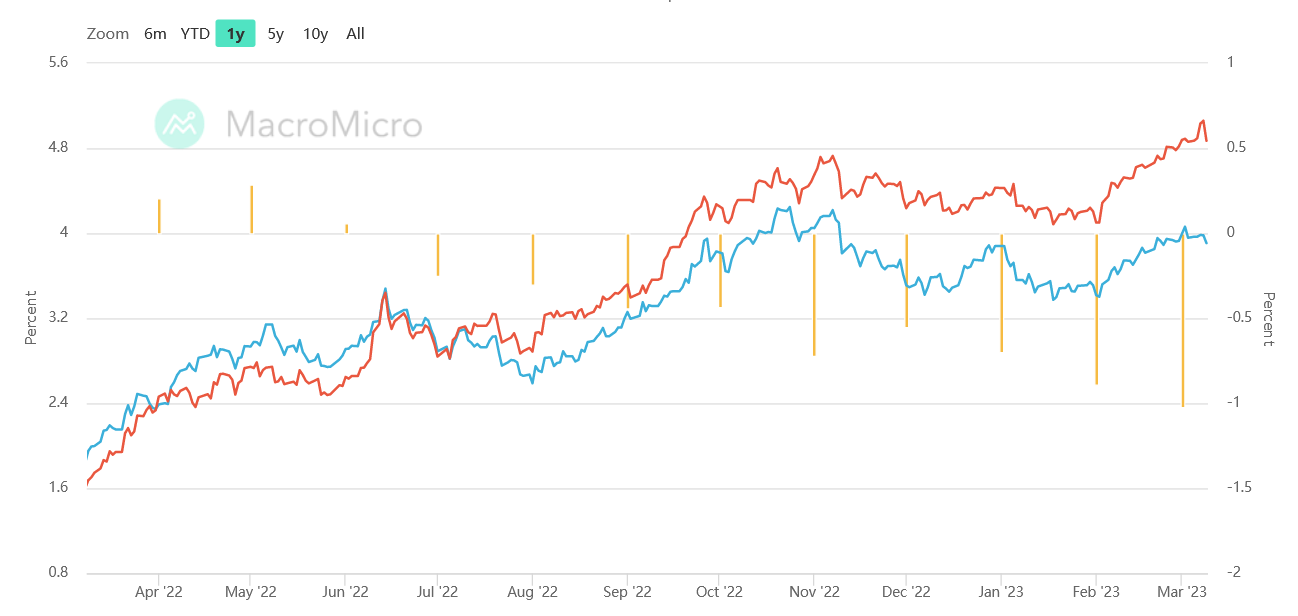
Shorter-dated yields soared, with the rate on the two-year note closing at a new high since mid-2007 at 5.015%. Yields on the 10-year Treasury notes, meanwhile, fell 1.5 basis points to 3.968%.

Here is a quick primer on what an inverted yield curve means, how it has predicted recession, and what it might be signaling now.

WHAT SHOULD THE CURVE LOOK LIKE?

U.S. yield curve reaches deepest inversion since 1981: What is it telling us?

The yield curve, which plots the return on all Treasury securities, typically slopes upward as the payout increases with the duration. Yields move inversely to prices.

A steepening curve typically signals expectations for stronger economic activity, higher inflation, and higher interest rates. A flattening curve can mean investors expect near-term rate hikes and are pessimistic about economic growth further ahead.

HOW DOES THE CURVE LOOK NOW?

Investors watch parts of the yield curve as recession indicators, primarily the spread between three-month Treasury bills and 10-year notes, and the two- to 10-year (2/10) segment.

Yields on two-year Treasuries have been above those of 10-year Treasuries since July.

That inversion reached negative 103.1 basis points on Tuesday as shorter term yields soared, the largest gap between shorter-dated and longer-term yields since September 1981. At that time, the economy was in the early months of a recession that would last until November 1982, becoming what was then the worst economic decline since the Great Depression.

“It’s not unusual to get a yield curve inversion but it is unusual to get one of this magnitude. We haven’t seen one like this in quite a while,” said Brian Jacobsen, senior investment strategist at Allspring Global Investments.

Deeper inversions do not necessarily mean deeper or longer recessions, Jacobsen said.

The curve plotting yields of three-month bills against those of 10-year notes, which had already inverted in intraday trading in July, turned negative in late October, closing inverted for the first time since early 2020.

WHAT DOES AN INVERTED CURVE MEAN?

The inversions suggest that while investors expect higher short-term rates, they may be growing nervous about the Fed’s ability to control inflation without significantly hurting growth. The Fed has already raised rates by 450 basis points over the last year.

The 2/10 year yield curve has inverted six to 24 months before each recession since 1955, according to a 2018 report by researchers at the San Francisco Fed. It offered a false signal just once in that time. That research focused on the part of the curve between one- and 10-year yields.

Anu Gaggar, global investment strategist for Commonwealth Financial Network, found that the 2/10 spread has inverted 28 times since 1900. In 22 of these instances, a recession followed, she said in June.

For the last six recessions, a recession on average began six to 36 months after the curve inverted, she said.

Before this year, the last time the 2/10 part of the curve inverted was in 2019. The following year, the United States entered a recession, albeit one caused by the pandemic.

WHAT DOES THIS MEAN FOR THE REAL WORLD?

When short-term rates increase, U.S. banks raise benchmark rates for a wide range of consumer and commercial loans, including small business loans and credit cards, making borrowing more costly for consumers. Mortgage rates also rise.

When the yield curve steepens, banks can borrow at lower rates and lend at higher rates. When the curve is flatter their margins are squeezed, which may deter lending.

(Reporting by Davide Barbuscia and David Randall; editing by Megan Davies, Tomasz Janowski and Richard Chang)

Author:Com21.com,This article is an original creation by Com21.com. If you wish to repost or share, please include an attribution to the source and provide a link to the original article.Post Link:https://www.com21.com/us-yield-curve-reaches-deepest-inversion-since-1981.html

Like (2)
Previous March 9, 2023 2:19 am
Next March 10, 2023 12:10 am

Related Posts

  • What the Inverted Yield Curve Means for Investors

    Investors around the world have been closely monitoring the inverted yield curve over the past few months. As the curve has become more inverted, worries about a potential recession have grown. The inverted yield curve is a powerful signal that the economy is headed for a downturn and investors need to be prepared for the potential fallout. The Yield Curve is the Most Inverted Since the Early 1980s An inverted yield curve occurs when short term interest rates are higher than long term interest rates. This has happened only twice…

    January 21, 2023
    1
  • Declining Gas Prices Ignite Optimism for Unprecedented Holiday Travel: A Comprehensive Examination of the Current Fuel Economy

    This Fourth of July, motorists across the nation are gearing up for road trips and family reunions, fueled by the significant dip in gas prices compared to the previous year. This decline in fuel cost is not only revving up the holiday spirit but also making a tangible impact on people’s travel decisions. Take Mathew Alvarez, a 36-year-old machinist from Los Angeles, for instance. Last year, the record-high gas prices prevented Alvarez from making the 100-mile journey to his family in Tehachapi, California, during the holiday season. As a response…

    July 4, 2023
    0
  • Uncertainty Surges Over Debt Ceiling; All Assets Sold

    Ugly inflation data in the UK was shrugged off by BoE officials (who likely don’t suffer from the cost of living crisis), but overall, today was thin on economic data and fat on economic crisis potential as markets woke up to the reality that the idiots in Washington are going to take this down to the line (or even just maybe cross it). June 1st T-Bill yields exploded above 7% today, …sending the spread to 5/30 bills to a mind-blowing record high… That’s a 430bps yield premium for 2 days…

    May 24, 2023
    0
  • Lessons from the 2023 Banking Crisis: Analysis, Impacts, and Strategies for Resilience

    The banking industry in 2023 has been disrupted by a series of unexpected events, throwing the global financial markets into disarray. Within a single week in March, three small to mid-sized U.S. banks, including Silvergate Bank, Signature Bank, and Silicon Valley Bank, failed. The collapse of these banks led to a sharp decline in global bank stock prices and triggered an immediate response by regulators to prevent a potential global contagion​​. The failure of these banks can be attributed to their significant exposure to cryptocurrency and mismanagement of their Treasury…

    May 18, 2023
    0
  • JOLTS Uncovered: Understanding the Report and Its Impact on Investors

    Introduction In the world of economic indicators, the Job Openings and Labor Turnover Survey (JOLTS) may not be as widely known as the nonfarm payrolls report, but it offers valuable insights into the U.S. labor market. This blog post will introduce you to JOLTS, discuss the information you can glean from the report, explain why job opening data matters, and highlight how investors can use this information. By the end of this post, you’ll have a better understanding of JOLTS and its significance in the economic landscape. What is JOLTS?…

    April 6, 2023
    0
  • Exploring the Potential of Emerging Markets in 2023

    The global economy is in the midst of a major transformation, and emerging markets have become a key focus for investors in recent years. As the US economy continues to expand, and other countries of the world struggle with low growth, many are turning to emerging markets for potential opportunities. In this article, we’ll explore the potential of emerging markets in 2023, and what factors may impact their performance. Will Emerging Markets Shine in 2023? It’s no secret that emerging markets have been underperforming for some time now. However, there…

    January 21, 2023
    0
  • The Impact of Labor Market on Fed’s Interest Rate Decisions

    The Federal Reserve, also known as the Fed, is the central banking system of the United States and is responsible for implementing monetary policy to achieve its dual mandate of maximum employment and price stability. The labor market is one of the key indicators that the Fed considers when making decisions about interest rates. In this article, we will discuss the impact of the labor market on the Fed’s interest rate decisions and how it affects the economy. The labor market is an indicator of the overall health of the…

    February 1, 2023
    0
  • Analyzing Central Banks’ Gold Accumulation and Its Implications for Individual Investors

    Introduction Central banks around the globe have been continuously increasing their gold holdings in recent years. This trend has raised questions about the reasons behind such decisions and whether individual investors should follow suit in investing in gold and other precious metals. In this article, we will analyze the factors driving central banks to accumulate gold and discuss investment strategies for individuals interested in the precious metals market. Diversification of reserves: One of the main reasons central banks increase their gold holdings is to diversify their foreign exchange reserves. By…

    April 18, 2023
    0
  • Navigating Inflation: Understanding Its Impact and Protecting the Middle Class

    Introduction to Inflation Inflation is the sustained increase in the general level of prices for goods and services in an economy over time. When the price level rises, each unit of currency buys fewer goods and services, effectively eroding the purchasing power of money. Inflation is usually measured as the annual percentage change in the Consumer Price Index (CPI) or the Wholesale Price Index (WPI). Causes of Inflation There are several factors that can contribute to inflation, such as an increase in demand for goods and services, a decrease in…

    March 30, 2023
    0
  • Factors Influencing the Federal Reserve’s Decision to Cut Interest Rates

    The Federal Reserve, also known as the Fed, is the central bank of the United States. One of its key responsibilities is to control monetary policy, which includes setting interest rates. The decision to cut interest rates is not taken lightly and is based on a variety of factors. Here are the key conditions for the Fed to decide to cut interest rates. Slow economic growth: If the economy is growing at a slow pace, the Fed may cut interest rates to stimulate economic growth. Low interest rates make it…

    February 5, 2023
    0

Leave a Reply

Your email address will not be published. Required fields are marked *