Understanding the Significance of a VIX Futures Backwardation and the Normalizing Yield Curve for Investors

Introduction

In the world of finance, keeping a close eye on various indicators is crucial for investors. Recently, two significant developments have captured the attention of the financial community: the VIX futures slipping into backwardation and the gradual normalization of the US Treasury yield curve, particularly the 2-10 portion. Both of these developments have important implications for investors. In this blog post, we’ll delve into the reasons behind these occurrences and why they matter to investors.

Understanding VIX Futures Backwardation

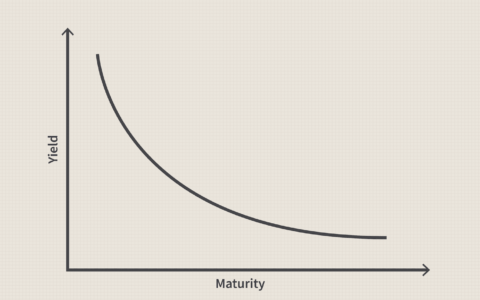
Before we dive into VIX futures backwardation, it’s important to understand the concept of futures curves. In normal times, the shapes of the VIX futures and US Treasury yield curves tend to resemble each other, both sloping upwards from left to right. The reason behind this similarity is rooted in the nature of interest rates. Bond investors typically demand higher yields for longer-dated bonds as they are more sensitive to changes in interest rates, making them more volatile. Investors generally prefer less volatile instruments, so they are willing to pay higher prices for shorter-term bonds.

Futures curves typically have an upward slope due to advantageous margin requirements. This means that investors can control a certain amount of a commodity while using only a small percentage of the money required to buy it when the futures contract expires. The unused money can be invested in risk-free assets, such as T-bills, which creates the upward slope in the futures curve. Nearer-term futures usually have lower prices than their longer-term counterparts, a condition called contango. The opposite situation is called backwardation.

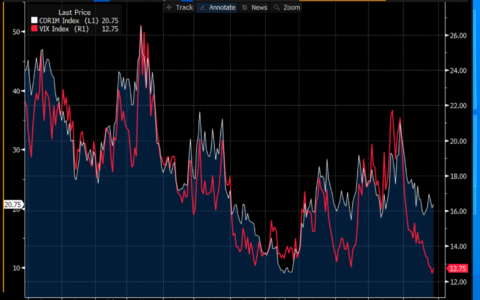
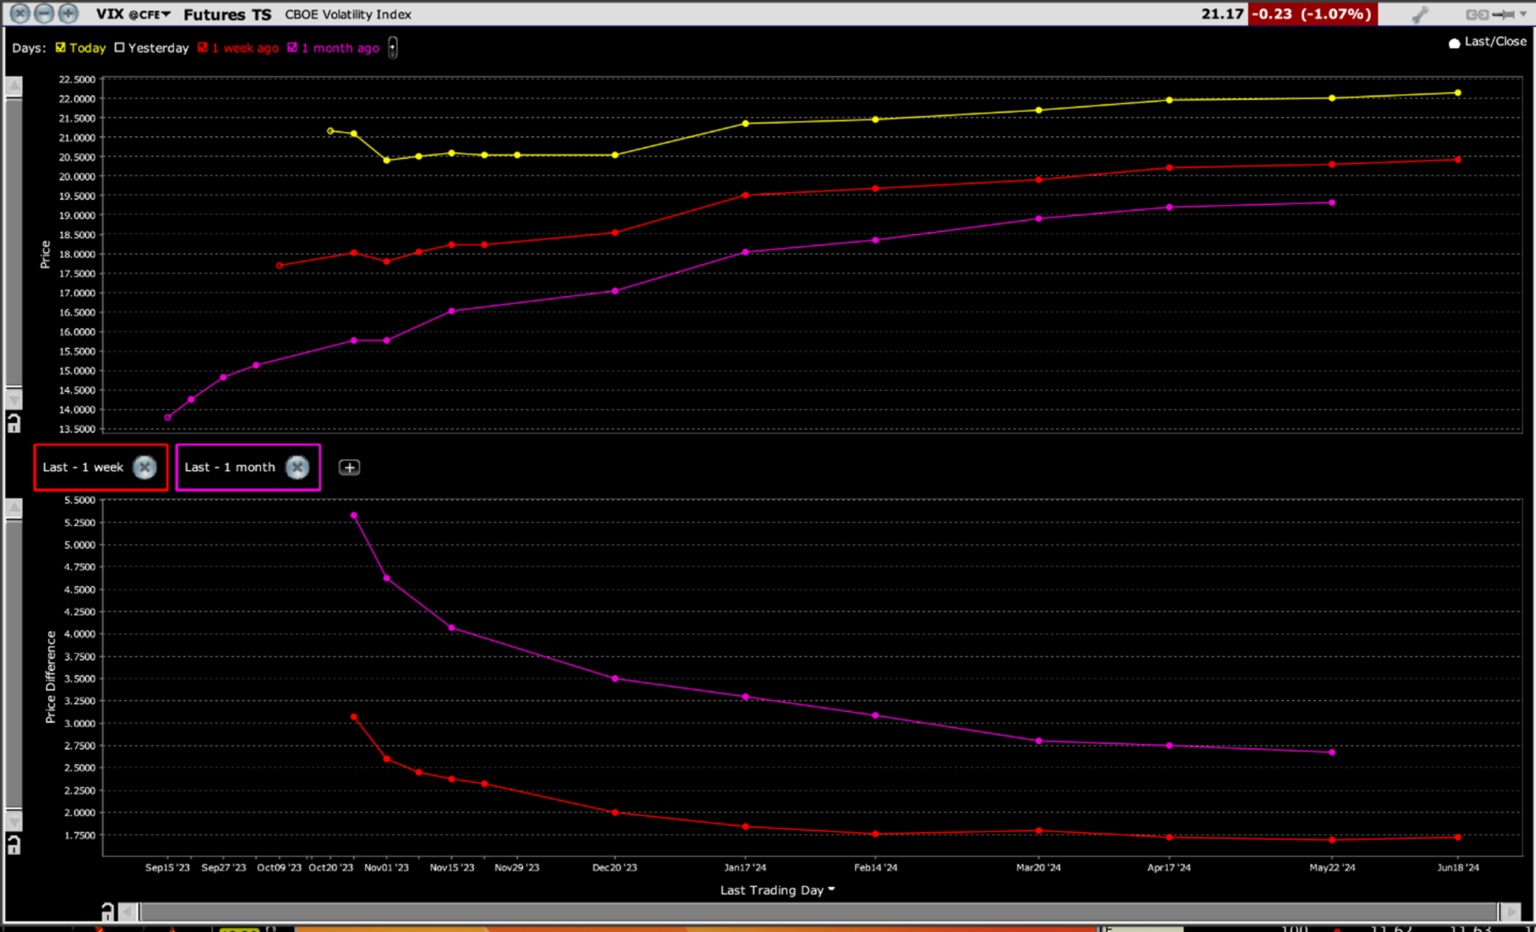
Backwardation occurs when the near-term demand for a commodity outstrips the supply. In the case of the VIX (Cboe Volatility Index), it’s a measure of volatility protection. Over the past year, despite various market uncertainties, volatility was in ample supply. However, recent demand for volatility protection has surged, and the futures curve has flipped into backwardation, indicating a change in market sentiment.

While the backwardation in the VIX futures curve is notable, it’s not at the levels that typically signal panic. Some traders view an inverted VIX curve as a contrarian indicator, but it’s not sufficient by itself to predict a market bounce. The curve can remain in backwardation for an extended period, and sell-offs usually end when demand for protection becomes extremely high, indicating an oversold condition.

VIX Futures Term Structure, Today (yellow, top), Last Week (red, top), Last Month (magenta, top), with 1-Week (red, bottom) and 1-Month Changes (magenta, bottom)

Understanding the Significance of a VIX Futures Backwardation and the Normalizing Yield Curve for Investors

The Yield Curve Normalizing

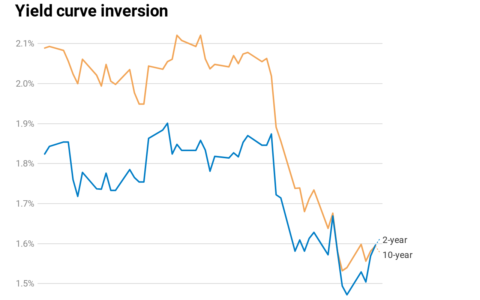
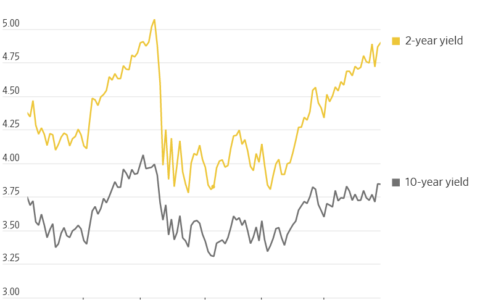
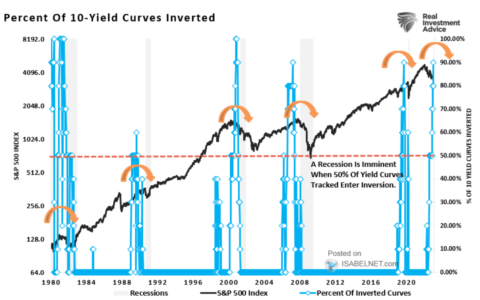
In parallel to the VIX futures curve, the US Treasury yield curve, specifically the 2-10 portion, has been inching closer to normalizing. In normal times, the yield curve slopes upwards, with long-term yields higher than short-term yields, driven by investor preference for liquidity and lower volatility. However, recent yield curve inversions have raised concerns about the possibility of an impending recession.

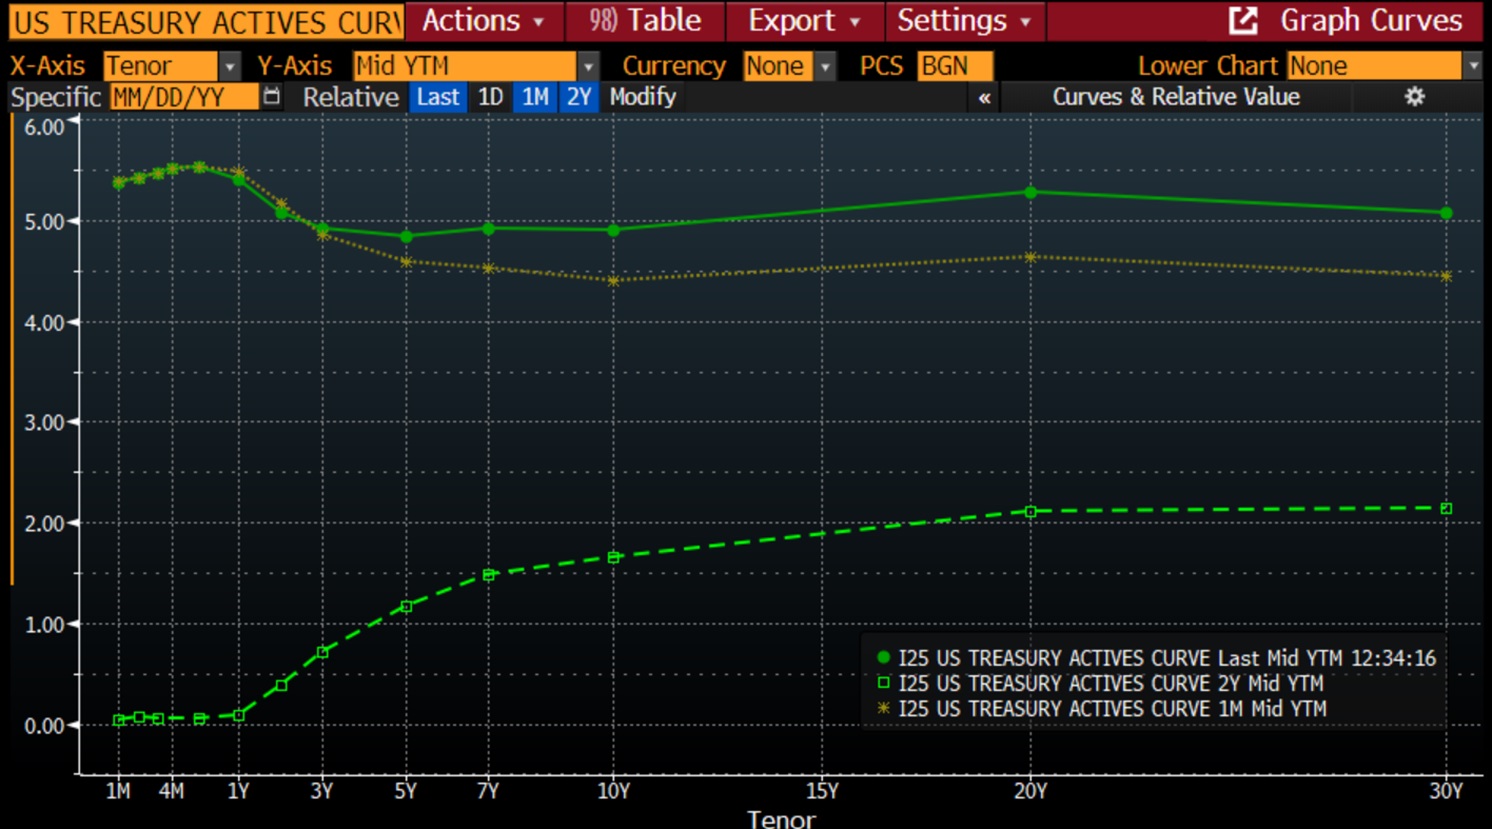
Historically, inverted yield curves have been strong indicators of future recessions, but it’s crucial to understand that recessions typically begin after the inversion ends. The recent yield curve data shows that while the overall level of rates was much lower two years ago, the shape of the curve is relatively normal compared to last month, suggesting an easing of the inversion.

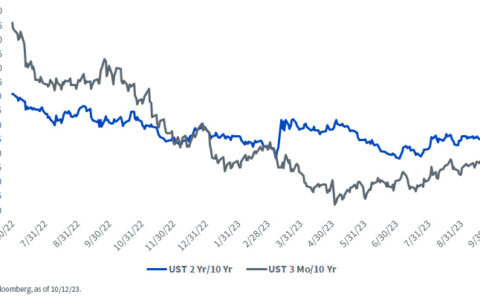
US Treasuries Active Yield Curve, Today (green line), Last Month (yellow), 2 Years Ago (green dashes)

Understanding the Significance of a VIX Futures Backwardation and the Normalizing Yield Curve for Investors

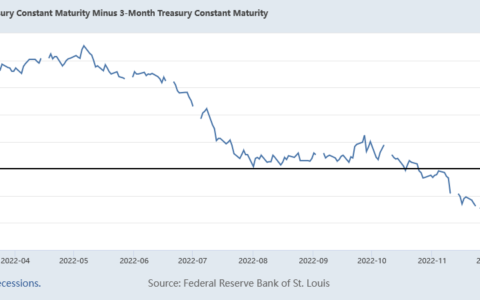
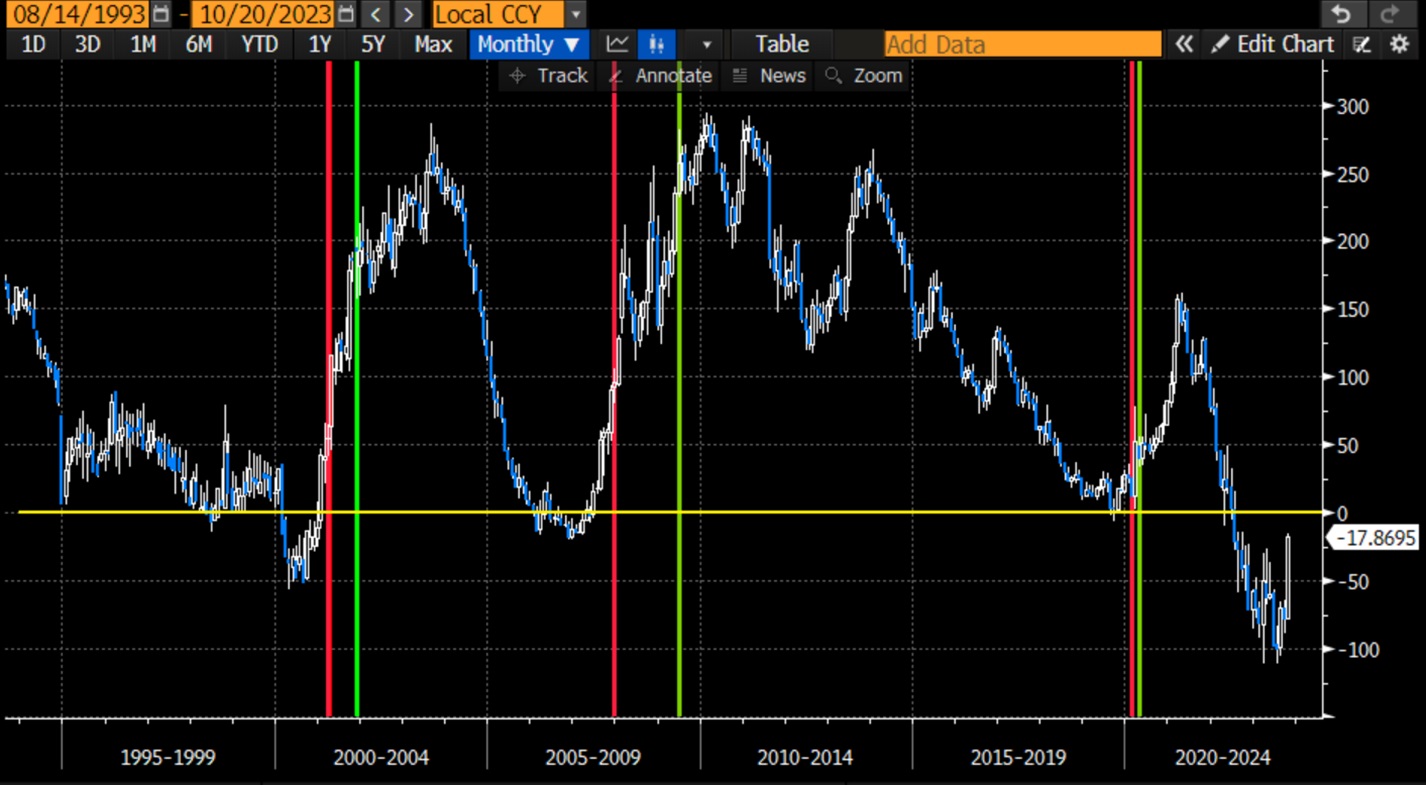
30 Years, 2-10 Treasury Yield Spread (blue/white bars) vs. NBER-defined Start (red) and End (green) of US Recessions

Understanding the Significance of a VIX Futures Backwardation and the Normalizing Yield Curve for Investors

Implications for Investors

These developments may not have an immediate influence on the markets, but they can significantly affect the paths of stocks, bonds, and the economy in the coming days and weeks. Investors should remain vigilant and consider the implications of VIX futures backwardation and the yield curve normalization on their investment strategies.

In conclusion, the recent backwardation in VIX futures and the normalization of the yield curve are important indicators for investors. While they may not provide immediate signals, they serve as valuable tools to gauge market sentiment and potential shifts in the investment landscape. Staying informed and being prepared for different market scenarios is essential for making sound investment decisions in an ever-changing financial landscape.

Author:Com21.com,This article is an original creation by Com21.com. If you wish to repost or share, please include an attribution to the source and provide a link to the original article.Post Link:https://www.com21.com/understanding-the-significance-of-a-vix-futures-backwardation-and-the-normalizing-yield-curve-for-investors.html

Like (2)
Previous October 19, 2023 11:24 am
Next October 20, 2023 1:18 pm

Related Posts

  • Navigating the Financial Storm: Exploring the Inverted Yield Curve’s Link to Economic Downturns

    I. Introduction The global economy is a dynamic and ever-changing landscape, where financial storms are often lurking on the horizon. One such storm that has caught the attention of economists, investors, and policymakers alike is the inverted yield curve. Often considered a harbinger of economic downturns, the inverted yield curve has become a topic of great interest for those looking to navigate the uncertain waters of the financial world. This article will explore the link between the inverted yield curve and economic downturns, shedding light on its significance and offering…

    March 21, 2023
    0
  • What the Inverted Yield Curve Means for Investors

    Investors around the world have been closely monitoring the inverted yield curve over the past few months. As the curve has become more inverted, worries about a potential recession have grown. The inverted yield curve is a powerful signal that the economy is headed for a downturn and investors need to be prepared for the potential fallout. The Yield Curve is the Most Inverted Since the Early 1980s An inverted yield curve occurs when short term interest rates are higher than long term interest rates. This has happened only twice…

    January 21, 2023
    1
  • Understanding the Inverted Yield Curve: A Harbinger of Recession in the U.S. Economy?

    From July 2022, the US bond market has witnessed a phenomenon that has traditionally been regarded as a warning sign for the economy: an inversion of the yield curve. As of May 29, 2023, the 2-year Treasury yield topped the 10-year rate, and the 10-2 Year Treasury Yield Spread fell to -0.84%. While the yield curve inverting doesn’t guarantee an economic downturn, it’s a signal that has preceded every recession in the past 50 years, thus creating a heightened sense of concern. Understanding what the yield curve is and what…

    May 29, 2023
    0
  • Understanding the Inverted Yield Curve: Its Causes, Significance and Impact on the 2023 Economy

    An inverted yield curve is a situation in which the interest rates on short-term Treasury bonds are higher than the interest rates on long-term Treasury bonds. This phenomenon is significant because it is often seen as a leading indicator of an impending recession. One reason why an inverted yield curve may occur is that investors believe that the economy will slow down in the future, causing them to demand higher interest rates on short-term bonds as compensation for the increased risk. Additionally, the Federal Reserve may raise short-term interest rates…

    January 21, 2023
    0
  • The Inverted Yield Curve: A Signal to Invest in Bonds

    When it comes to investing, it is important to stay informed of market trends and news. An inverted yield curve is one such indicator that can provide insight into potential investment opportunities. This article will explore what an inverted yield curve is, what it signals, and why investors should consider investing in bonds during an inverted yield curve. We will also discuss the benefits, risks, and strategies to maximize returns when investing in bonds during an inverted yield curve. What is an Inverted Yield Curve? An inverted yield curve is…

    January 24, 2023
    0
  • Riding the Yield Curve: How Treasury Bonds Signal Economic Optimism Amid Uncertainty

    As we enter the latter half of the year, government-bond yields have shown a discernible climb during the second quarter, fuelled by signals of robust economic vitality and a lessening of distress within the banking sector. Investors predict that these yields could continue their upward trajectory in the months to come. In the opening months of the quarter, bonds were rallying as investors grappled with a series of swift banking collapses, sparking fears of a wider crisis that could impede the flow of money and credit to households and businesses….

    July 1, 2023
    0
  • Understanding the Impact of an Inverted Yield Curve

    If you’ve been following financial news lately, you’ve probably heard of the inverted yield curve. But what exactly is an inverted yield curve and what impact can it have on the economy? In this article, we’ll explore the concept of an inverted yield curve and the effects it can have on interest rates, mortgages, and the possibility of a recession. What Is an Inverted Yield Curve? An inverted yield curve is a type of graph showing the yields of bonds in relation to their maturities. A normal yield curve is…

    January 21, 2023
    0
  • The Unpredictable Path of Inverted Yield Curves: Are They Still the Harbingers of Recession?

    Introduction In the world of finance and economics, few indicators have been as closely scrutinized and widely discussed as the yield curve. The inversion of the yield curve, specifically the U.S. Treasury yield curve, has often been heralded as a harbinger of impending recession. However, in recent times, the yield curve’s predictive power has come under question as it defies conventional wisdom. So, have inverted yield curves lost their way? Let’s delve into the intricacies of this intriguing phenomenon and see if it’s time to rewrite the rulebook. The Inversion…

    October 20, 2023
    0
  • Has Volatility Been Permanently Subdued? Unraveling the Mysteries Behind VIX’s Low Levels

    In the world of finance, veterans often rely on the Cboe Volatility Index (VIX) to gauge the market’s anticipation of volatility over the next 30 days. However, a curious scenario has emerged as VIX languishes in the 12-13 range despite historical precedents of higher levels during periods of investor optimism. This prompts us to explore the question: Has volatility been permanently subdued, or are there underlying factors at play that might suggest a different narrative? The Nature of VIX: More Than Just a Fear Gauge It’s crucial to dispel the…

    November 28, 2023
    0
  • The Uncertainty of the Record-Breaking Interest Rate Curve Inversion as a Recession Predictor

    The financial world has been abuzz with talk about the record-breaking inversion of the interest rate curve. The interest rate curve, a graphical representation of interest rates for bonds of different maturities, has traditionally been seen as a reliable indicator of an impending recession. However, the question on everyone’s mind is whether the current inversion will accurately predict a recession this time. An inverted interest rate curve occurs when long-term interest rates are lower than short-term rates. This is a departure from the typical scenario where long-term rates are higher…

    February 5, 2023
    0

Leave a Reply

Your email address will not be published. Required fields are marked *